
How to Look Up Berks County Jail Population Data
County jail population data lives in a few official places. The Berks County Prison Board reviews monthly figures such as average daily population, commitments, and out-of-county housing in its minutes. National data groups publish county-level numbers that are easier to compare. The Bureau of Justice Statistics is the federal source for jail and prison data.
For Berks-specific trends, the Vera Institute publishes a county page with jail population, the pretrial and sentenced split, capacity, and rates. For national and state context, the Bureau of Justice Statistics is the standard reference. These two sources, plus the county's own Prison Board minutes, cover most population questions.
Note: Population figures are point-in-time and update often, so confirm the latest values from the Prison Board minutes or the source page before citing them.
Berks County Jail Capacity Overview
The county holds people at one main facility. The Berks County Jail System sits in Leesport, north of Reading. The county has not published a single designated-capacity number in the pages reviewed, but it has studied long-term capacity needs as part of a correctional facility project. The table below sums up the facility.
| Facility | Address | Capacity |
|---|---|---|
| Berks County Jail System | 1287 County Welfare Road, Leesport, PA 19533 | Not published in official online sources; capacity studied in the facility project |
When the jail runs near or over its working capacity, the county has at times housed inmates in Lehigh County and Wayne County, as noted in Prison Board records.
Berks County Average Daily Population
Average daily population, or ADP, is the headline number. It is the average count of people held on a given day over a period. The county's April 2025 Prison Board minutes reported a year-to-date average daily population of about 700 inmates for March 2025, along with 1,016 commitments. Those figures are point-in-time and should be confirmed against the latest Prison Board minutes.
| Measure | Reported Figure | Source |
|---|---|---|
| Average daily population (March 2025, YTD) | About 700 | April 2025 Prison Board minutes |
| Commitments | 1,016 | April 2025 Prison Board minutes |
ADP tends to move with arrest volume, court speed, and bail practices, so a single month is a snapshot rather than a trend.
Demographic Breakdown
Who is held matters as much as how many. The Vera Institute tracks the jail's makeup by race, ethnicity, and gender, and it compares those shares to the county population. One Vera figure stands out: in 2023, Black men made up 24.1% of the jail population while making up only 4.5% of county residents. That gap is the kind of disparity the data is meant to surface.
| Group | Share of Jail Population (2023) | Share of County Residents |
|---|---|---|
| Black men | 24.1% | 4.5% |
Vera also tracks women's incarceration, race and ethnicity comparisons, and the number of people the jail holds for other jurisdictions. Each of those breakdowns helps explain who is in custody and why the total moves. The Vera Institute publishes a dedicated county page for Berks.
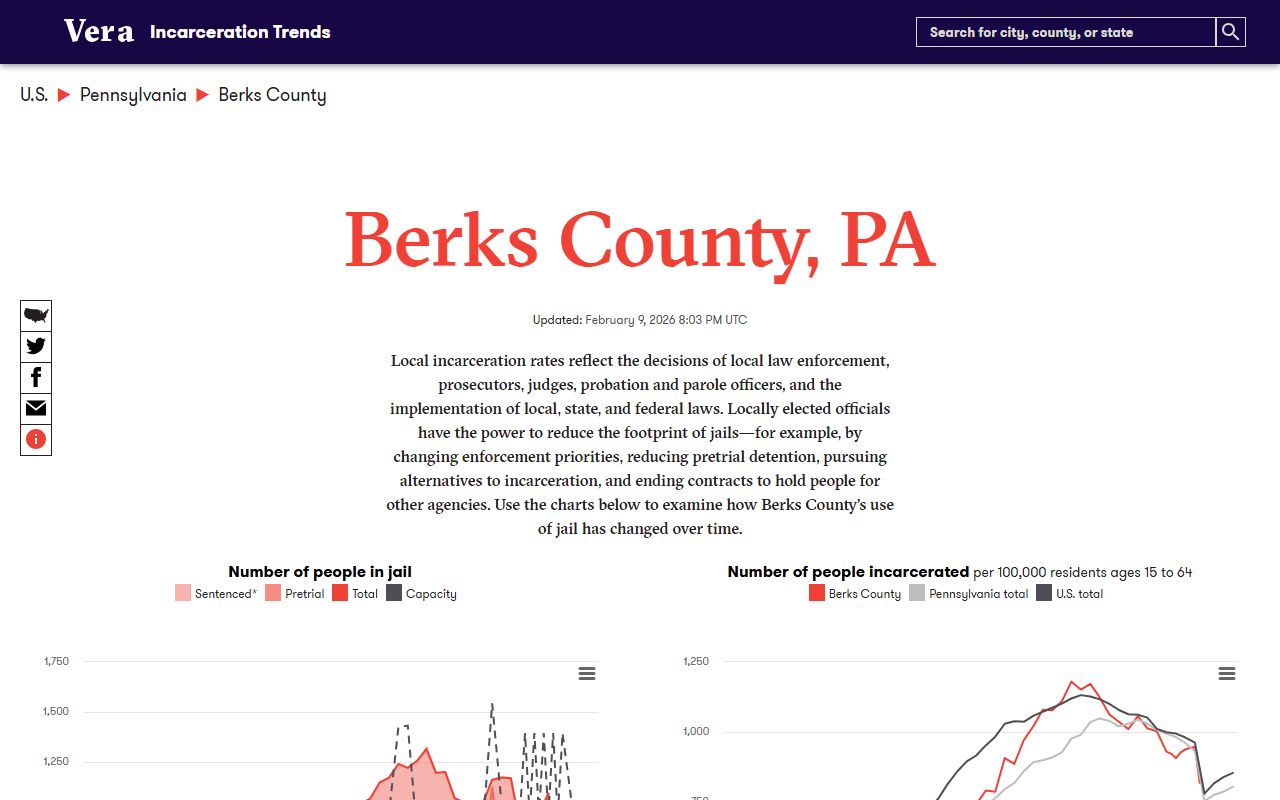
For the full demographic picture, the Vera incarceration trends page for Berks County holds the detailed charts, last updated in October 2024.
Pretrial vs Sentenced Population
Jails hold two broad groups. Pretrial detainees are held while their cases are open, often because they cannot post bail. Sentenced inmates are serving a term after conviction. The split between them is a key fairness measure, since a large pretrial share can point to bail practices rather than convictions.
| Group | What It Means | Where to Find the Split |
|---|---|---|
| Pretrial | Held while a case is open, before any conviction | Vera county trends |
| Sentenced | Serving a term after conviction | Vera county trends |
Vera publishes the Berks pretrial and sentenced split on its county page, which is the best source for the current ratio.
Misdemeanor vs Felony Population
Population data also splits by charge level. Some people in the jail face misdemeanors; others face felonies. County jails generally hold people awaiting trial on all grades, plus those serving shorter county sentences. People serving long state sentences go to state prison, not the county jail. That is why a county jail count looks different from a state prison count for the same area.
The county does not publish a simple public misdemeanor-versus-felony chart in the pages reviewed. The Prison Board minutes and the facility project documents are the best route to that breakdown, available through the county's open records process described on the public records page.
Mental Health and Medical Population
A share of any jail population needs mental health or medical care. Berks County's treatment court program exists in part to divert people with substance use and mental health needs away from custody and toward treatment. The jail itself lists social restoration, counseling, and rehabilitation among its goals.
Detailed medical and mental health population counts are sensitive and are not posted as public roster data. Aggregate figures, when available, appear in Prison Board reports, annual reports, or facility audits rather than in any online lookup. For the treatment court side, the arrest records page describes the program tracks.
National and State Context
A county number means more next to a state and national number. The Bureau of Justice Statistics publishes jail and prison data for the nation and the states, including incarceration rates per 100,000 residents. The Vera Institute reports the county rate so you can line it up against the broader picture.
The Bureau of Justice Statistics is the federal source for this data.
The Bureau of Justice Statistics lets you compare the Berks rate against state and national figures. The comparison below shows where each rate comes from.
| Level | Source | What It Reports |
|---|---|---|
| County | Vera incarceration trends | Berks jail rate per 100,000 residents ages 15 to 64 |
| State | Bureau of Justice Statistics | Pennsylvania jail and prison rates |
| National | Bureau of Justice Statistics | United States jail and prison rates |
Because these rates update on their own schedules, pull the current value from each source rather than relying on an old figure. Comparing the three levels shows whether Berks sits above or below the wider trend.
Population Trends Over Time
Berks County has been active on jail policy for several years. County materials show a 2018 Criminal Justice Master Plan, a 2021 facility condition review, a 2022 needs assessment, and population-reduction work from 2023 onward. The county concluded that a new correctional facility would be more cost-effective than renovating the old one. In May 2025, the Vera Institute released a Berks jail report called "Wasted Resources," built with local partners from the stories of 121 people affected by incarceration plus official jail data.
The project timeline fills in the steps. County materials cite a needs assessment update from February through August 2022, a programming phase from March through July 2022, and population-reduction exploration from February 2023 to the present. The county also opened a Youth Shelter program in July 2024. Together these point to active, ongoing work on confinement policy rather than a fixed plan.
Cost is part of the trend too. The county's 2026 proposed budget reported a jail net cost of $54.2 million, up from $53.4 million in 2025. That rise, set against the population work, shows why the county weighed a new facility against renovation. For year-by-year population counts, the Vera county page and the monthly Prison Board minutes are the sources to export.
What Drives the Berks County Jail Count
The daily count is not random. Several forces push it up or down, and they shift month to month. Arrest volume feeds the front door. Bail practices decide how many people stay before trial. The speed of the courts decides how fast cases clear. When local beds run short, the county has housed people in Lehigh County and Wayne County, which keeps them in the count even though they sit outside Berks.
Policy choices matter too. Treatment courts and diversion can move people out of custody and into supervised programs. A backlog of cases can hold the pretrial number high. Because so many factors feed one number, a one-month change rarely means a lasting shift. The trend over many months tells the real story, which is why the Prison Board reviews the figures on a regular schedule.
Reading the Population Numbers Carefully
Jail data is easy to misread. A county jail count is not the same as a state prison count, and the two should not be added together. People serving long sentences are in state custody, while the county jail holds pretrial detainees and shorter county sentences. An incarceration rate per 100,000 residents lets you compare places of different sizes, but each source measures it on its own schedule.
Point-in-time figures also drift. A March average daily population is a snapshot, not a fixed value, so a number from one report may not match the next. When the exact figure matters, cite the report and its date, mark whether the number is county, state, or national, and pull the current value before you publish.
Searching for Berks County Inmate Records by Name
Population data is about the whole jail, not one person. To look up a single inmate by name, the tools are different. Custody status and release alerts run through PA SAVIN and the jail booking line, which are covered on the Berks County inmate records page. Use that page for individual lookups, and use this page for counts, capacity, and trends.
Where the Data Comes From
Three sources carry most of the weight. The Berks County Prison Board minutes report monthly average daily population, commitments, releases, and out-of-county housing. The Vera Institute publishes county-level trends, demographics, and rates. The Bureau of Justice Statistics provides the state and national backdrop. For exact numbers, request the monthly Prison Board minutes, jail or PREA annual reports, or the budget message through the county's open records process. The public records page explains how to file that request. Pulling from more than one of these sources is the best way to cross-check a figure, since each one is compiled on its own schedule and may capture a slightly different snapshot of the same population.